
Insights
Insights shows what the AI gets out of the recorded calls: what calls are about, how they go, whether problems are solved and what the quality is. For Managers and Administrators only.
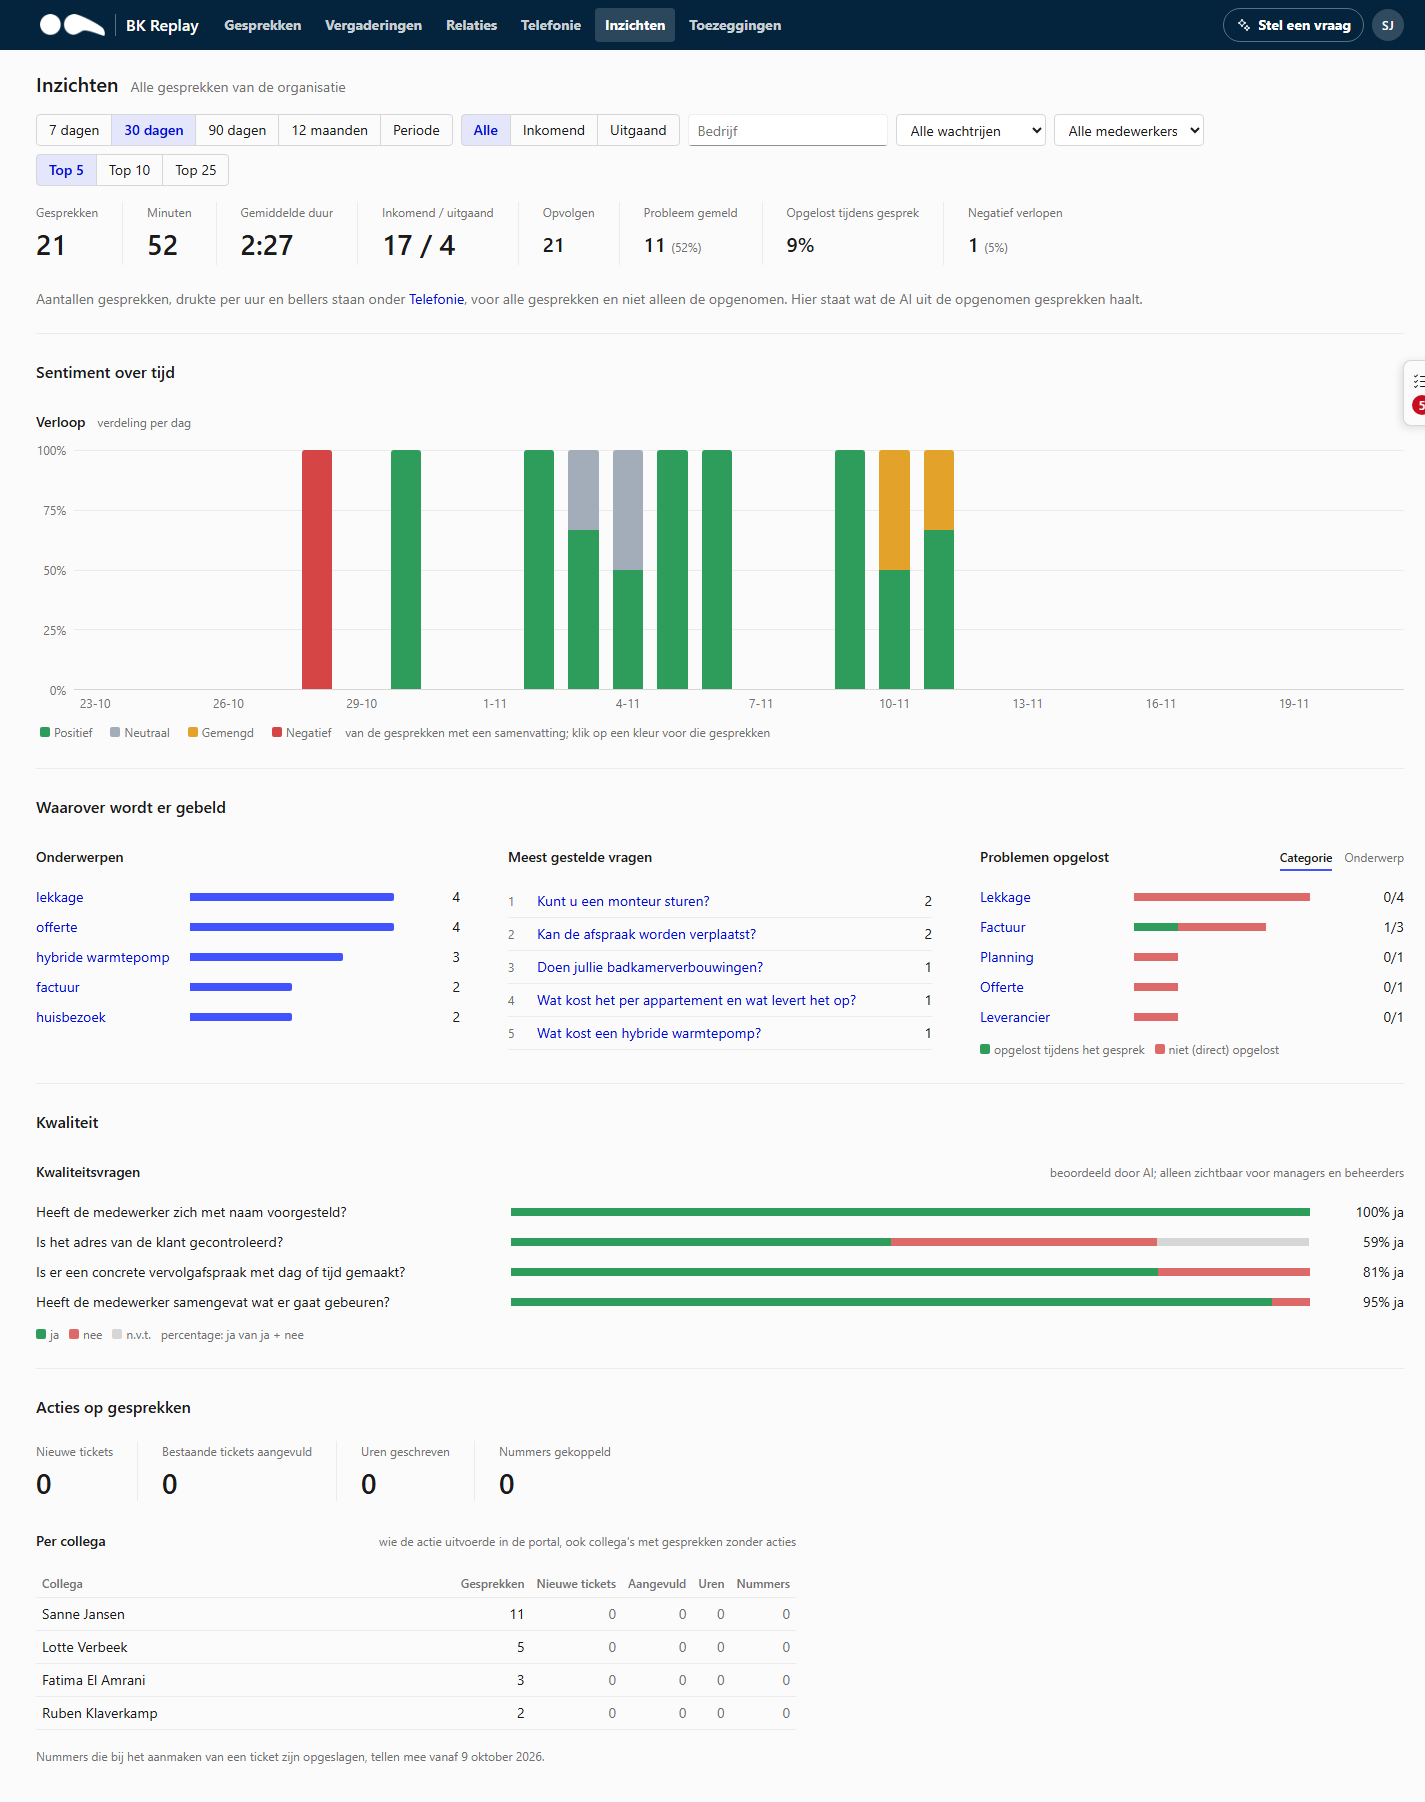
Numbers of calls, busy hours and callers are on the Telephony page, for all calls and not only the recorded ones. If your organisation does not have Telephony, this page is called Statistics and those parts are shown here, based on the recordings.
Filters
Choose a period (7 days to 12 months, or a custom period), direction, company, queue or employee. With one employee chosen you only see their calls, for example to prepare a one-to-one. Top 5, 10 or 25 sets how long the lists are.
Sections
- Tiles: number of calls, minutes, average duration, incoming and outgoing, how many need follow-up, how often a problem was reported, how many of those were solved during the call and how many calls ended negatively.
- Sentiment over time: per day the split between positive, neutral, mixed and negative. Click a colour for those calls.
- What are calls about: the most common topics, the callers' most asked questions and problems solved per category or topic.
- Quality: the answers to your organisation's quality questions, as a percentage of yes.
- Actions on calls: how many calls were sent to your PSA (new tickets, existing tickets added to, hours logged), per colleague.
Click a topic, question or bar to see the calls it is about.
The figures per employee and the quality questions assess employees' work. Discuss their use with your works council beforehand if you have one.